← All posts
Web
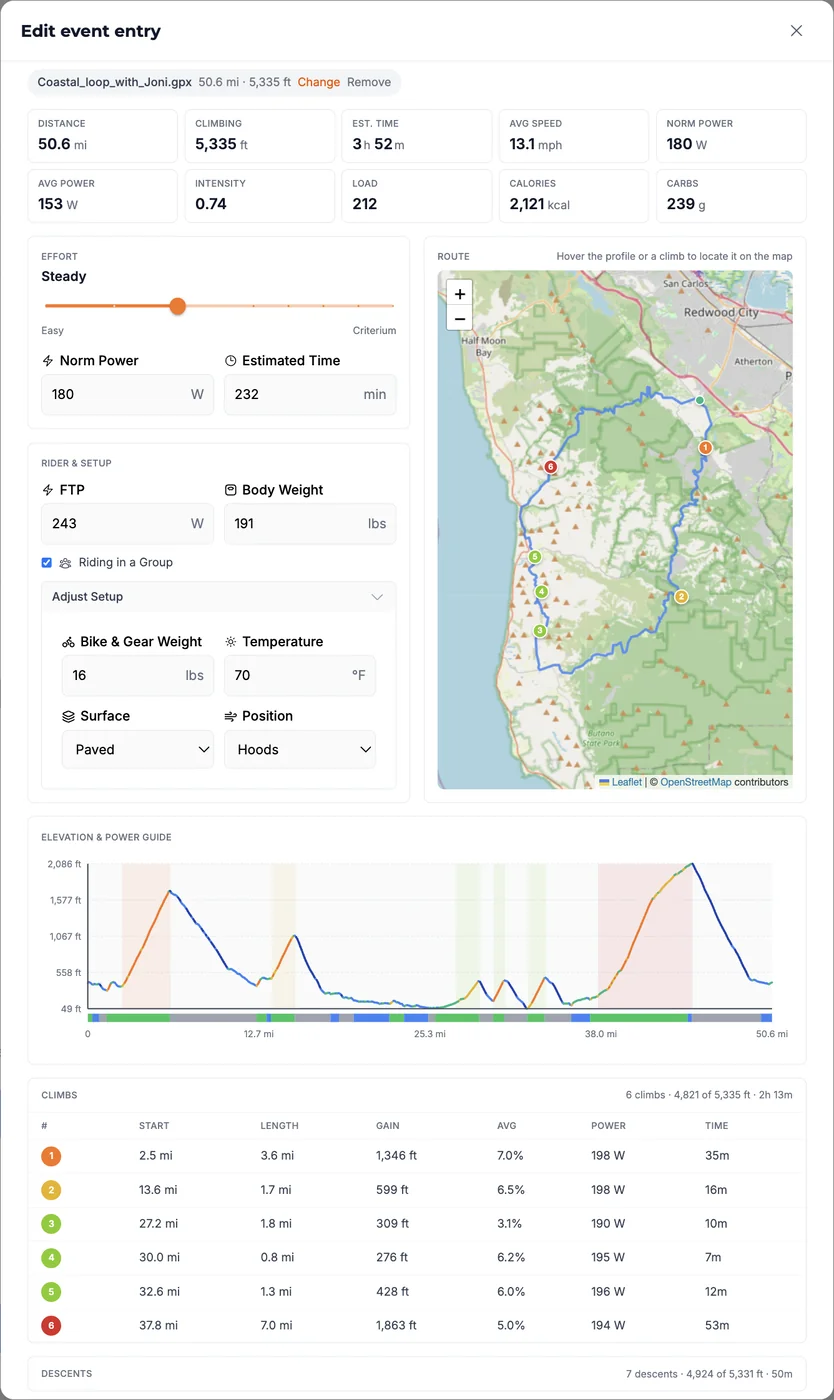
The event modal now has two tabs. General is still where you say what the event is, where it is and how long the course is. The new Course Analysis tab turns that into a plan: upload the route as a GPX file, pick how hard you intend to ride, and Tempo simulates the ride segment by segment and answers with the numbers that matter — Distance, Climbing, Est. Time, Avg Speed, Norm Power, Avg Power, Intensity, Load, Calories and Carbs.
Effort is one choice you can express three ways. Drag the Effort slider through Easy, Moderate, Steady, Hard, Very Hard, Threshold, Time Trial and Criterium, or type a Norm Power, or type an Estimated Time. Set any one and the server solves for the other two: ask for a four-hour finish on a hilly course and you get the normalized power it requires; type 210 W and you get the time it buys.
The answer is physics rather than an average speed applied to a distance. Tempo runs the Martin et al. (1998) cycling power equation over every segment of the course: gravity against the gradient, rolling resistance for the surface you are riding, and aerodynamic drag against your position, with air density scaled for altitude and temperature. Rider & Setup shows exactly what it assumed. FTP and Body Weight come from your profile and are shown read-only, with a warning when Tempo is falling back to a default. Riding in a Group applies a drafting factor to the aerodynamic term, and is switched off for events ridden alone — a time trial by rule, a cross-country or downhill race because there is nothing to sit behind. Under Adjust Setup sit Bike & Gear Weight, Temperature, Surface (Paved, Mixed, Unpaved roads, Off-road trails) and Position (Upright, Hoods, Drops, Aero bars), each starting from a default for the event type: a criterium assumes 9.5 kg and the drops, an enduro 20 kg and upright. Every constant behind those defaults, and the study it came from, is written up in the pacing plan reference in our repository.
With a GPX course attached, three linked views sit below the numbers. Route draws the course on a map with each climb numbered, its marker shaded by how hard the climb is, from green for the gentlest to deep red for the hardest, and carrying the same number and color as its row in the table below. Elevation & Power Guide draws the profile colored by gradient, with each climb shaded, over a strip that says which power zone to ride each stretch in — neighboring stretches are merged while their targets are close, so you get a handful of steps to follow rather than a new number every fifty meters. Climbs and Descents list every one with its start, length, gain or drop, average gradient, target power and time. Hover a climb row or any point on the profile and the same stretch highlights on the other two, so "the steep one at 48 km" becomes a place on the map.
Without a GPX file you still get the headline numbers. The server lays out hills that add up to the distance and climbing you typed, which is enough for the totals to hold; a profile, power guide or climb list drawn from invented hills would not be, so none is shown.
Whatever the plan says is what gets saved on the event: duration, load, calories and carbs. Your fitness projection, the event card and the fuel plan all read the same numbers you were looking at when you saved.
Until now the duration and load on an event were a guess, and everything downstream inherited the guess. A gran fondo entered as four hours because four hours sounded right sets up a taper for the wrong day and a fuel plan for the wrong ride, and the error compounds as the event approaches. Course Analysis replaces the guess with a simulation of your route at your FTP, on your bike, at the temperature you expect.
It also answers the question that actually decides the day: how hard to ride the parts that count. Riding the first climb 20 W too hard is the most reliable way to lose an hour later, and the power guide gives you a number for each climb before you are on it, with the descents laid out so you know how long the recovery between them is. And because the plan carries calories and carbs, the fueling target moves with the effort you chose instead of sitting on a default.
Open Calendar, click a date and choose Add event entry, or open an event you have already created. Fill in the event type and distance on General, then switch to the Course Analysis tab and click Upload a GPX course. Move the Effort slider and watch the cards update, open Adjust Setup if your bike or the forecast differs from the default, and save.
Note: The Elevation & Power Guide, Climbs and Descents sections require a Premium subscription. The course metrics, the Effort slider and Rider & Setup are visible to everyone.
A 50.6 mi coastal loop with 5,335 ft of climbing, ridden Steady at an intensity of 0.74: 3 h 52 m at 180 W normalized, 212 Load, 2,121 kcal and 239 g of carbs to plan for. Six climbs carry 4,821 ft of that climbing and 2 h 13 m of the ride, and the last one — 7.0 mi at 5.0%, starting at mile 37.8 — is 53 minutes at 194 W.