← All posts
Web
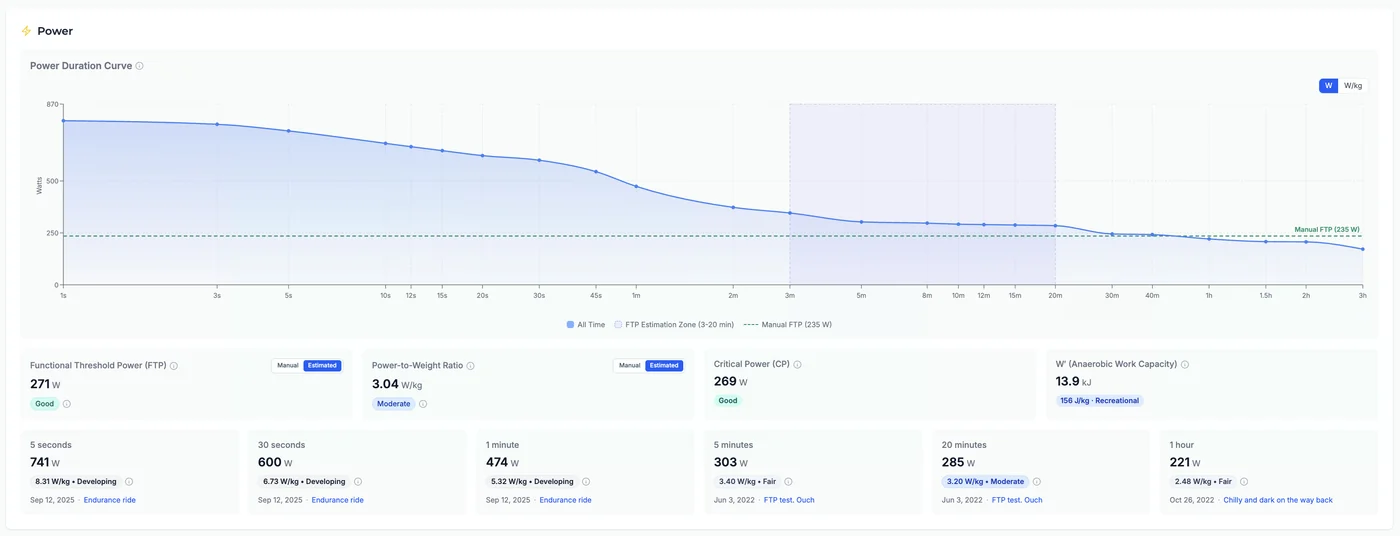
We've added Critical Power (CP) and W′ (W-prime) to the Performance page—the two parameters of the critical-power model rooted in endurance physiology (Monod & Scherrer, 1965). CP is the highest power you can hold in something close to steady state: the line above which fatigue ramps quickly. It often tracks FTP within a few watts, but unlike a fixed 60-minute test target, CP comes from your best 3-minute and 12-minute efforts over the dates you select.
W′ is the finite amount of work you can spend above CP before you have to settle back down—your anaerobic "matchbook." Hard efforts above CP spend it; time below CP lets it refill. Larger W′ usually means sharper attacks, longer surges, and bigger breakaways. Both tiles sit in the Power section of Performance, only for cycling, next to FTP, power-to-weight, and power bests. CP is in watts with a Coggan-style tier badge, same spirit as FTP. W′ is shown in kilojoules; its badge combines mass-normalized capacity (for example 220 J/kg) with tier labels from Developing through Recreational, Trained, Strong, and Elite.
We solve the Monod–Scherrer two-parameter model from two points: your best 3-minute and best 12-minute power in the chosen window. They can come from deliberate tests or ordinary rides, from the same ride or different days—no tagging, no workout selection. With P3 and P12 in watts, CP = (4 × P12 − P3) ÷ 3 and W′ = 240 × (P3 − P12) joules: 518 W for three minutes and 403 W for twelve give about 365 W and 27.6 kJ. Both durations are required, other durations don't affect the numbers, and a new best at either one recalculates both.
W′ accuracy deserves a straight note: two points fix the curve exactly, so the estimate is only as honest as the efforts behind it. If your best 3-minute effort wasn't truly maximal, W′ comes out small—not because your anaerobic capacity vanished, but because your data hasn't demonstrated it yet—and Tempo hides an implausible W′ and says why. The cleanest input is a 3- and 12-minute maximal test, the protocol the research supports (Simpson & Kordi, 2017): warm up, go all-out for 3 minutes, ride easy for a while, then go all-out for 12. And because your date range controls the lookback, a stronger effort that has dropped out of the selected dates is called out next to the tiles—a lower number alone doesn't mean you've lost fitness.
You get a sharper read on the sustainable ceiling (CP) and how hard you can go above it before paying the bill (W′)—so FTP and bests sit in fuller context for pacing, interval design, and understanding why certain efforts feel manageable vs. draining.
Open Performance, scroll to Power, and pick your date range like usual—the new Critical Power and W′ tiles appear alongside your other cycling power summaries.
Note: Applies to cycling activities only. Estimates reflect the best 3- and 12-minute efforts in your selected range and underlying power data quality. Recalculating them does not change your training FTP or zones.